bubble chart
US /ˈbʌb.əl tʃɑːrt/
UK /ˈbʌb.əl tʃɑːt/
名詞
バブルチャート
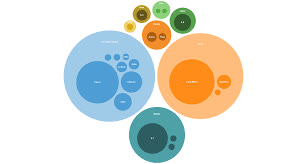
a type of chart that displays three dimensions of data, where each data point is represented by a bubble whose size indicates the third value
例:
•
The marketing team used a bubble chart to compare market share, growth rate, and total revenue.
マーケティングチームは、市場シェア、成長率、総収益を比較するためにバブルチャートを使用しました。
•
In a bubble chart, the area of the circle represents the magnitude of the data point.
バブルチャートでは、円の面積がデータポイントの大きさを表します。